

Customer insights
The Customer Insights page helps you understand what customers are asking about and how they feel about the experience. It combines intent classification, sentiment scoring, frustration detection, and resolution tracking into a single view to help you identify emerging topics, detect dissatisfaction early, and measure whether the agent resolves the intents it encounters. Navigation: Project → Insights → Customer Insights Date range selector: Use the toggle to select 7d, 30d, or 90d. Filters: Select All environments and All channels at the top of the page to narrow the data by deployment environment and channel. Filter selections are reflected in the page URL, so you can bookmark a filtered view or share it with a colleague.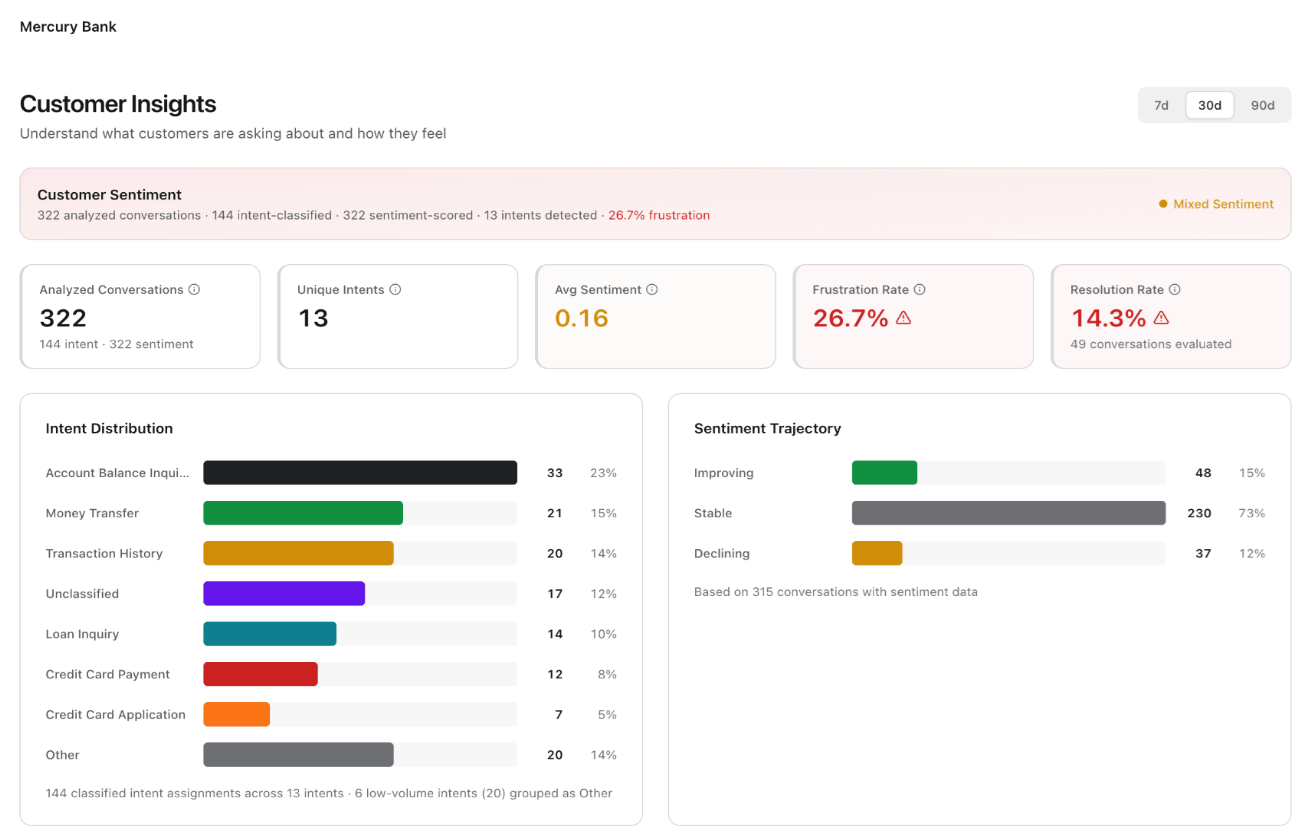
Customer sentiment summary
A banner at the top displays a contextual summary of the analyzed data, for example: “322 analyzed conversations · 144 intent-classified · 322 sentiment-scored · 13 intents detected · 26.7% frustration.” A sentiment indicator (for example, “Mixed Sentiment”) provides a quick qualitative read.KPI metric cards
Intent distribution
A horizontal bar chart ranks detected intents by volume. Each bar shows the intent name, count, and percentage of total conversations. The chart groups low-volume intents (typically those below a threshold count) into an “Other” category. The footer indicates the total classified intent assignments and how many low-volume intents the chart grouped.Sentiment trajectory
A side-by-side panel displays conversation counts across three sentiment directions:
The footer indicates the total conversations with sentiment data contributing to the trajectory analysis.
Trends over time
A section below the distribution charts plots intent volumes and sentiment scores as time-series data, enabling you to track whether specific intents are growing or shrinking and whether sentiment is trending in the right direction.Feedback
The Feedback page surfaces end-user feedback captured directly from chat sessions. It gives you access to raw ratings and verbatim comments so you can identify satisfaction patterns, detect underperforming agents or channels, and prioritize improvements based on what users say. It reports feedback across the project. To read the results of one survey, see Feedback insights. Navigation: Project → Insights → Feedback Date range selector: Use the toggle to select Today, 7d, or 30d. Filters: Select All environments and All channels at the top of the page to narrow the data by deployment environment and channel. Filter selections are reflected in the page URL, so you can bookmark a filtered view or share it with a colleague.Filters
Four filter controls let you narrow feedback results:
Select Refresh to reload feedback data with the current filter selections.
Feedback table
The table lists one row per piece of feedback. Alongside the rating, comment, agent, and channel, two columns identify who left the feedback.Export feedback
Select Export to download the filtered feedback as a CSV file. The export includes User ID and Custom dimensions alongside the ratings, comments, and session references, so you can join feedback to your own customer records offline.Feedback insights
The Feedback Insights page reports the results of a single feedback survey. Use it to read the headline score, see how the score moved, find the segments driving it, and open the individual responses behind it. Feedback Insights reads the responses collected against a feedback template. Responses reach the page from agents that reference the template and from external systems that submit through the public feedback API. Until you create a template, the survey list offers only the built-inmessage_feedback capture, and the page prompts you to set up a survey before it reports anything.
Navigation: Project → Insights → Feedback Insights
Date range selector: Use the toggle to set the reporting window, for example, Last 7 days.
Filters: Select All environments and All channels at the top of the page to narrow the data by deployment environment and channel.
Export: Select Export CSV to download the current results for offline analysis.
Survey and score method
Two controls at the top of the page define every figure below them.Overview
The Overview tab reports the headline score for the selected survey, the comparison against the prior period, and the count of externally submitted responses. Below the score, the response funnel shows how many of the people who met the survey went on to answer it.
The funnel also reports two rates. The response rate needs a presented count, and reads as not available until the survey records one. The comment rate reads as not applicable when the survey doesn’t ask for comments.
Surveys have no answer window, so a late response can still turn an abandoned survey into a scored answer.
Read the margin before the number
The page styles a change as movement only when the change clears the combined margin of both periods. An index built from two proportions carries roughly twice the margin of a plain percentage at the same sample size. NPS is such an index: it subtracts the share of detractors from the share of promoters. At the same number of responses, the same visible gap on an NPS figure means less than it would on a plain percentage.Trend and distribution
The Trend & distribution tab shows how the score moved across the selected period, and how the responses spread across the rating scale. Use the granularity control on the Trend panel to change the interval, for example, from daily to a wider grouping.Segments
The Segments tab breaks the score down by the dimensions the platform records with each response.
Select Movers first to order segments by the size of their change. The page orders segments by significance, so a segment with few responses can’t headline the list on a dramatic-looking number alone.
Responses
The Responses tab lists the individual responses behind the figures on the other tabs. Four controls let you narrow the list.
If no responses match, the tab reports that it found no feedback for the selected filters. Widen the date range or clear a filter.